


From the EPEC Team Newsletter:
Senior Data Analyst Rick Naigle finds a statistically significant gap in R-leaning mail-in ballots being kicked to ‘unmarked’ status for ‘cure’ during processing than D-leaning ballots.
Virginia Special Election Early Voting Update:
—Turnout is Way beyond 2025, Heading for 2024 Rates
—Unusually High Rejection Rates for Republican-leaning Mail-ins
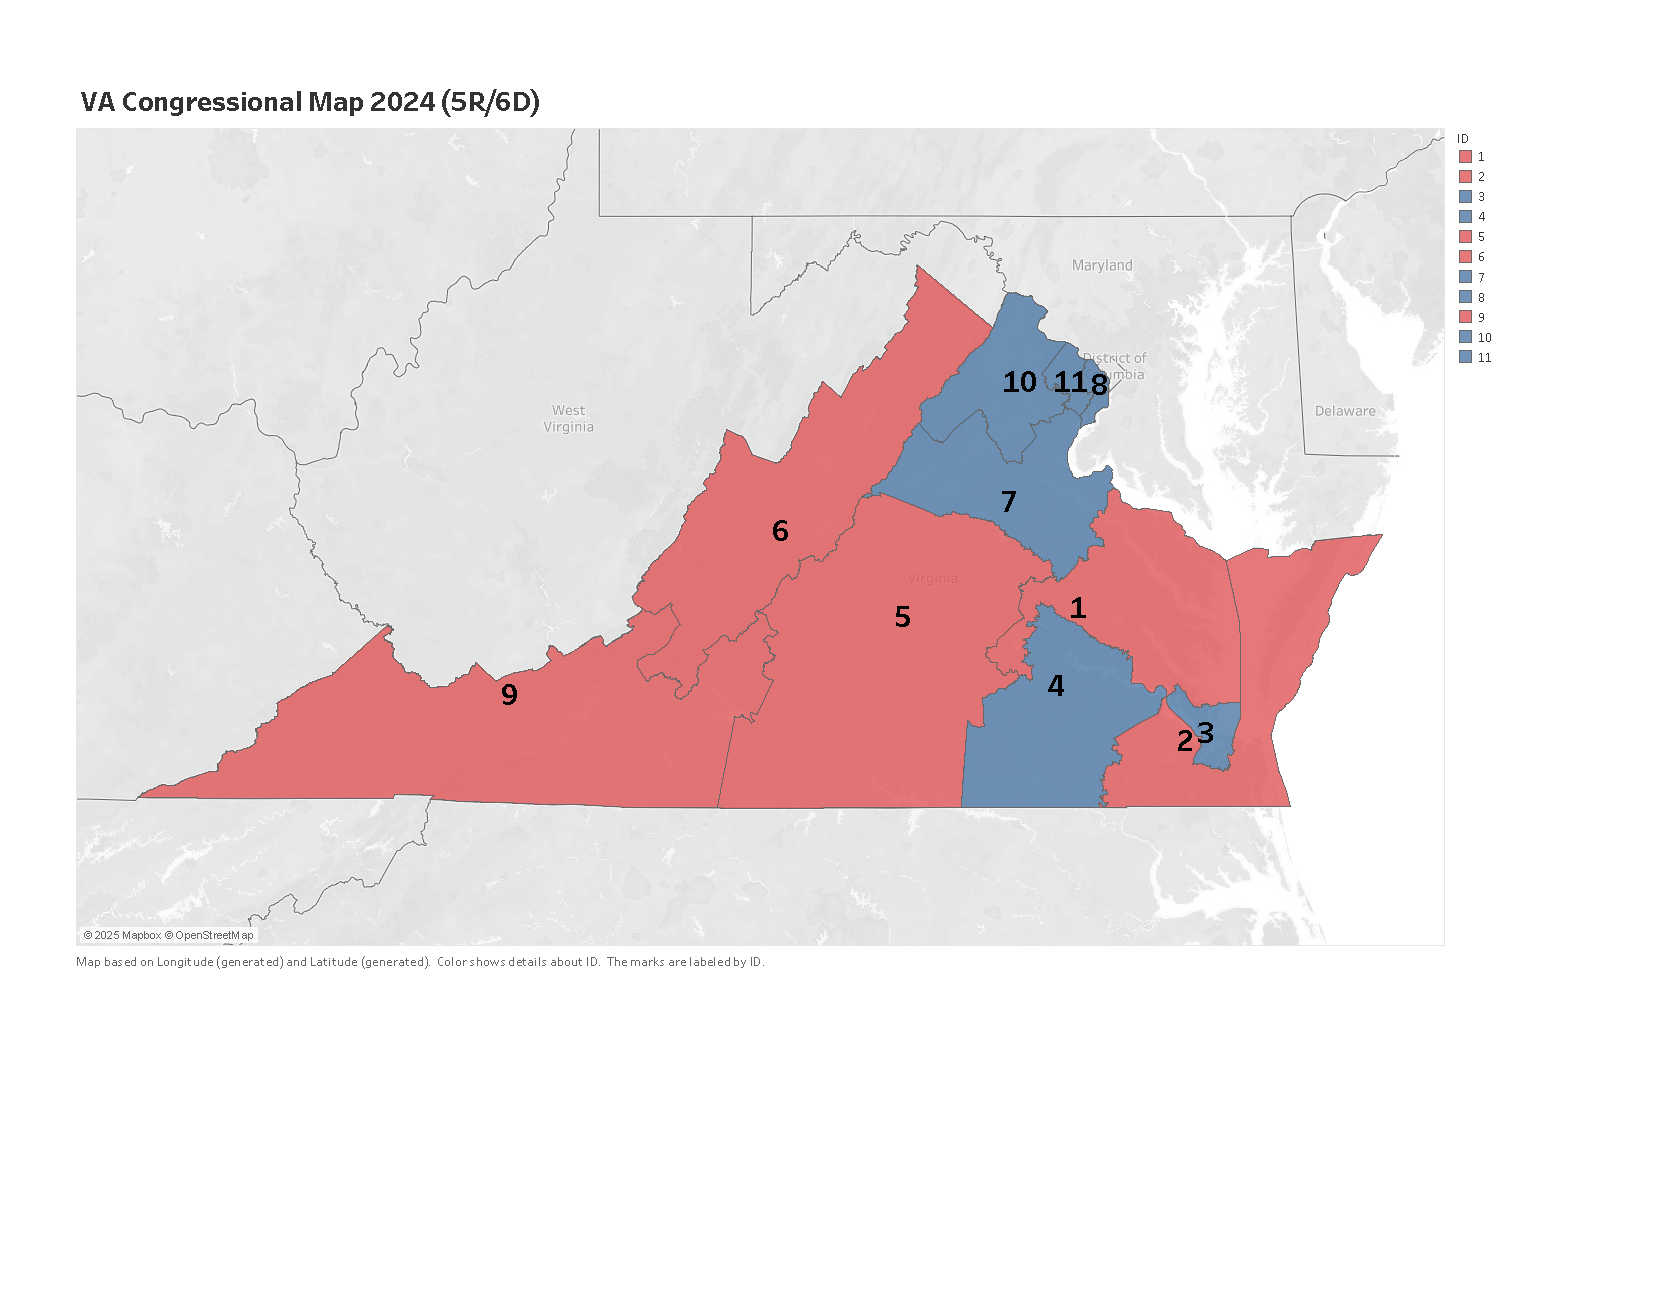
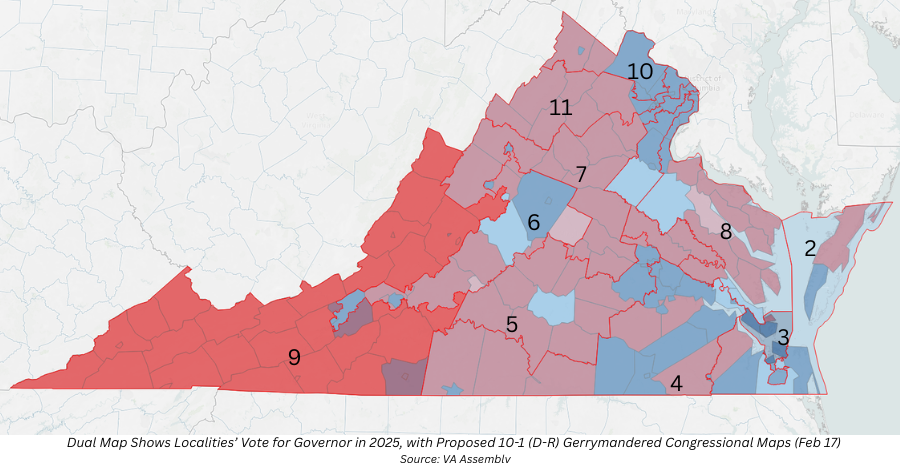
The turnout surge in Virginia’s controversial Special Election over whether to “temporarily” allow Assembly Democrats to gerrymander congressional maps from the current 6-5 (D-R) to 10-1 (D-R) shows no signs of abating in the unofficial data.
Record mail-in ballot return volumes may explain high rejection rates of Republican-leaning ballots that EPEC Team Senior Data Analyst Rick Naigle has documented.
He also sees big fluctuations in rejection rates based on volume of mail-ins.
Naigle notes:
“Presumed R voters have a substantially higher probability their ballots are recorded as Unmarked (rejected) (~13.6%) than Presumed D (~2.2%) or Unknown (~1.7%); differences R vs D and R vs Unknown are highly significant (p << 0.001).”
His latest analysis raises questions as to whether localities are able to manage the volume of mail-in ballots with consistency before they are prepared for tabulation.
Just over 1.08 million ballots are in issued (“still out”) or countable (“mail-ins” + “on machine”) status, close to 1/3rd of the 3.4 million ballots cast in the entire 2025 gubernatorial election.
Overall, we are at about 18% voter turnout as the early voting period concludes on Saturday, April 18th before the April 21 vote.
As of April 15, just under 150,000 mail-in ballots were in “issued” status, not yet returned. They are coming into many localities in huge spikes, which we documented here last week.

Volume Comparisons:
Mail-in (est.) differences:
2025: 208,143
2026: 257,099
On Machine (est.) differences:
2025: 442,408
2026: 726,423
Since last Saturday, localities have opened satellite voting areas through the last day of early voting on April 18 before Election Day on April 21.
At this rate, the 2026 numbers are racing to reach similar numbers as the 1.3 million ballots in the 2024 election that were in “countable’ status at this stage of early voting.

Wild Fluctuations in Rejection Rates of R-Leaning Ballots
Using Daily Absentee List (DAL) of unofficial voting data from Virginia’s Dept. of Elections, and ChatGPT-5 Mini to help compute statistical analysis, Naigle reviewed acceptance (“Marked” & “Pre-Processed”) and rejection (“Unmarked”) rates on mail-in ballots over a 25-day period.
- He looked at Portsmouth and Virginia Beach City localities’ mail-in ballot data, and analyzed statewide volumes.
- In local processing, he found an 11-point difference in the rejection rates of presumed R vs. presumed D ballots (based on light modeling and primary election voting history).
- Using statewide data, he found that lean-R ballots show a higher probability (statistically significant) of their ballots being rejected into “unmarked” status.
- This could mean that election staff are likely finding errors (“material omissions”) on the security ballot envelope and putting it aside for a “cure.”
- Voters whose ballots are “unmarked” are supposed to be contacted within three days to address the issues. They can either request a new mail-in (and take their chances with the postal service), or turn in the mail ballot and vote on machine.
- Naigle finds no statistically significant rejection rate differences between known D ballots and unknown voter history.
- His take:
“The overall ballot rejection rate is higher on days where the total number of ballots received is lowest. That is statistically significant — which means there is some kind of ‘special cause’ for this finding. It is not random.”
See selected slides from his full report below:


